

Written by Richard Conn
Many companies incorporate social media into their affiliate marketing and content marketing strategies. One of the most popular social media sites is Instagram. Instagram has over one billion users worldwide and was worth around $24 billion in 2020. This makes it a go-to place for businesses to advertise their brand. But how do you know if your Instagram marketing efforts are bearing fruit?
Have you ever looked at Instagram analytics?
Let’s look at business phones, for example. To choose the right company phone plans, you need analytics like customer service data and employee productivity. Why? So you know which plan will best suit your company's needs based on the numbers collected.
Likewise, you need Instagram analytics to make your Instagram marketing strategy a success. From attracting followers to deciding when to post, Instagram analytics can help all aspects of your campaign.
In this article, we'll cover:
- Where to find Instagram analytics.
- The different types of Instagram analytics.
- How your goals determine which metrics to track.
- How to use Instagram analytics to improve your content strategy.
Where to find Instagram analytics
Instagram Insights are Instagram's in-app analytics. At the moment, they’re only available on your mobile. To track metrics on your computer, you need a third-party platform. There are both paid and free platforms that track Instagram analytics. In this article, though, we’ll focus on Instagram Insights.
To use Instagram Insights, you need to set up a business or creator profile (if you haven't already). You can then access Instagram Insights by tapping the menu button in the top-right corner of your profile page.

The different types of Instagram analytics
There are many analytics available on Instagram Insights, including:
- Profile analytics
- Audience analytics
- Instagram Stories analytics
- Post analytics
- Instagram Shopping analytics
- Instagram Live analytics
- Video analytics
- Instagram Reels analytics
1. Profile analytics
You can access your profile analytics on your profile page. These analytics cover the past week and include:
- Impressions: how many times someone saw your posts.
- Interactions: how many actions (like visiting your profile or tapping a link) people took on your account.
- Reach: how many unique accounts saw your posts.
- Profile visits: how many people viewed your profile.
- Website taps: how many times people tapped the link to your website.
- Call/email taps: how many times people tapped the call/email button.
- Mentions: how many times other users mentioned your account.
2. Audience analytics
Audience analytics give you an overview of your followers for up to 90 days. Metrics include:
- Follower growth: includes follows and unfollows.
- Top locations: the top five cities or countries your followers live in.
- Age range: 13-17, 18-24, 25-34, 35-44, 45-54, 55-64, or 65+.
- Gender: men or women.
- Most active times: the hours or days your followers are most active on Instagram.
This kind of customer behavioral data is particularly helpful. It lets you see who’s interested in your content and when you’re most likely to reach them.
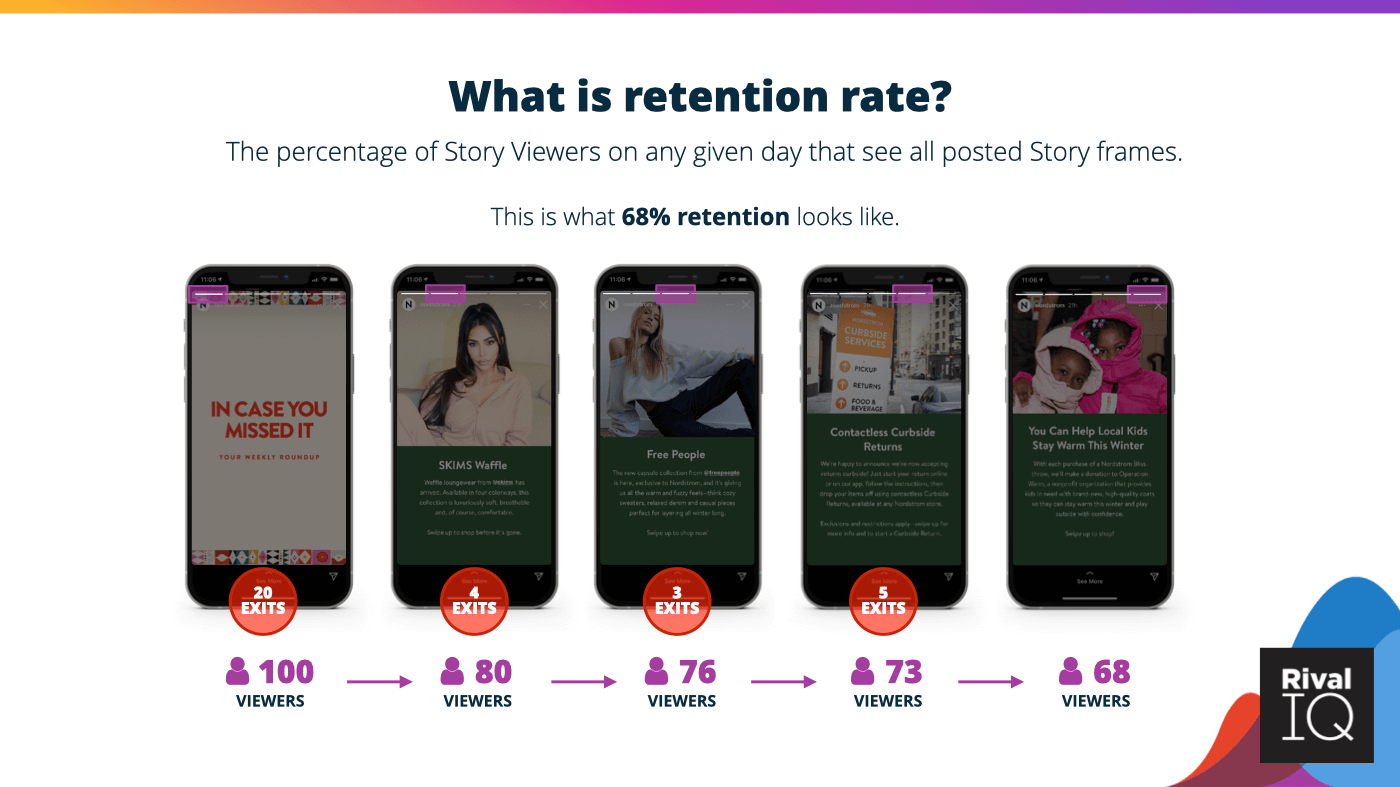
3. Instagram Stories analytics
About half of all Instagram users use Instagram Stories. They’re a series of posts you can enhance with photos, videos, text, audio, and stickers. They only last 24 hours, but they’re a great way to reach your audience. You can even add a website link to your Instagram Story!
Besides the other metrics, you can view:
- Navigation taps: how many times people tapped back, forward, next story, or exit.
- Retention rate: how many viewers saw all the frames in a Story.
- Follows: how many unique accounts followed you.
- Get directions/text taps: how many times someone tapped to get directions or text.
- People insights: how many accounts saw a frame of your story.
- Replies: how many people replied to a video or picture.
4. Post analytics
There’s a whole range of feed post analytics available on Instagram Insights. You can look back on up to two years of metrics, including:
- Comments: how many times someone commented on your post.
- Likes: how many unique accounts liked your post.
- Saves: how many unique accounts saved your post.
- Video views: how many views your video had.
- Discovery: number of unique follows, and account reach.
- Business address taps: how many times people tapped the business address button.
- Engagement: how many people engaged with your post.
You can also tap “View Insights” under a published post to view all the main metrics.
5. Instagram Shopping analytics
With Instagram Shopping, you can see product tags, buy items, and save items to your wishlist. It's a great way to show off your products and connect with potential buyers. And, just as online phone services have specific call efficiency metrics, Instagram has specific shopping metrics. These include:
- Product page views: how many views your product page had.
- Product button taps: how many times someone tapped a button relating to your product, like “save”.
6. Instagram Live analytics
Instagram Live videos disappear as soon as the broadcast ends. But you can still view metrics during the broadcast, which you can screenshot if you want to keep them. Instagram Live analytics include reach and comments as well as:
- Peak concurrent viewers: the most viewers you had during the broadcast.
- Shares: how many people shared your broadcast.
7. Video analytics
You can view video metrics for up to two years, including audience retention metrics like:
- Average percentage watched: on average, how much of your video did people watch.
- Percentage of plays: how many people were watching your video at a particular time.
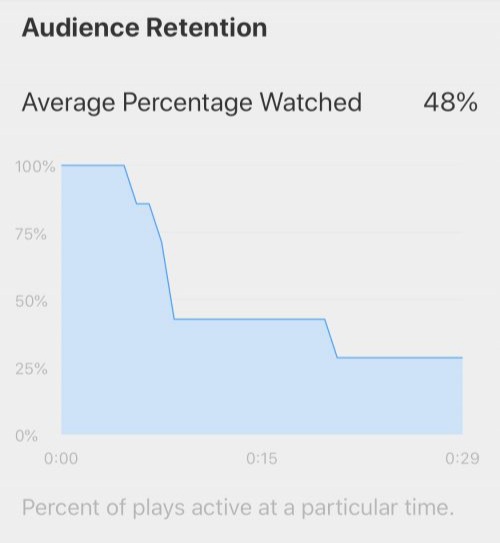
These metrics show how engaging your videos are, so you'll know if you need to tweak them to keep people hooked.
8. Instagram Reels analytics
Instagram Reels lets you create 30-second, multi-clip videos. Businesses can insert Instagram Reels ads between reels, so they’re a good way to promote your brand. Specific metrics for Instagram Reels include:
- Plays: how many people played a reel.
- Reel interactions: how many actions people took on a reel (like comments and shares).
How your goals determine which metrics to track
Before you dive into the world of Instagram analytics, you need clear goals and objectives. These determine which metrics will inform your Instagram affiliate marketing or content strategy. For instance:
- If you’re looking to build brand awareness, you should focus on follower count, impressions, likes, and reach.
- If your goal is to boost sales, you should focus on website clicks, call/email clicks, and most active times.
- If you want to build an interactive community, you should focus on comments, engagement, shares, and replies.
By focusing on the metrics that are insightful, you’ll have more time to complete the things that are important for your marketing strategy.
How to use Instagram analytics to improve your content strategy
You can use the metrics from Instagram Insights to improve your content strategy. How? There are several ways, for example:
- Getting to know your target audience.
- What content works best for your brand.
- What to avoid in future.
Let’s look at these in more detail.
Getting to know your target audience
You can use Instagram Insights to work out the best times to post to get the most engagement. And metrics like age, gender, and location can give valuable insights into the type of content your audience will like. As an example, let’s look at age groups.
Different issues interest different age groups. Younger age groups are more likely to want clarity from brands on issues like racism, sexism, and climate change. While older age groups may be more concerned with health and financial security.
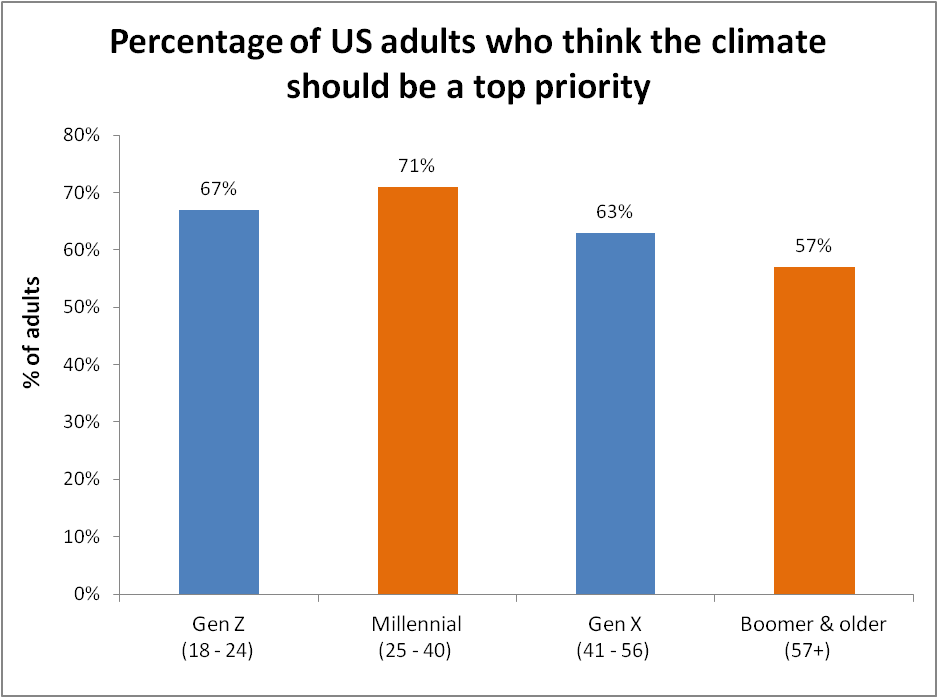
If most of your audience is young, posts about life insurance won’t get nearly as much engagement as posts about tackling climate change.
What content works best for your brand?
Many metrics give helpful insights into the content people are engaging with - so you can focus on creating more of it. Here are some examples:
- Follower growth: let's say you notice a surge in followers after posting about your cloud based call center technology. Including this topic more often in your content strategy could help grow your audience.
- Impressions: looking at where and when impressions came from can help you refine your posting schedule. If certain topics get more impressions, you'll know what kind of content works well for you. And if you get lots of impressions from hashtags, you know you're using the right hashtags for your brand.
- Likes, comments, and shares: if posts about climate change get more likes, comments, and shares, you may have found what resonates with your audience. So focus your content strategy on that.
What to avoid in the future
Other metrics can tell you what to avoid. For instance, the “Exited” metric shows when people lost interest in your story. If lots of people exited on the first frame, it could mean your intro didn't hook them. If people are exiting on the sixth or seventh frame, you may need shorter Stories in the future.
Analyze and adapt
Just as test coverage metrics can assess your testing strategy, Instagram analytics can assess your Instagram strategy. Instagram analytics shows what works for your brand, so you can adapt your marketing strategy accordingly. You’ll then be well on your way to making the most of Instagram with content that knocks your audience’s socks off.
About Author
Richard Conn is the Senior Director for Demand Generation at 8x8, a leading telephone system for businesses and communication platform with integrated contact center, call monitoring software, voice, video, and chat functionality. Richard also wrote an article on 8 Ways to Communicate and Build Rapport With Loyalty Program Members.